

India Housing Market 2026: Are New Home Bookings Really Declining?
An Eight-Month Data-Driven Analysis of Pune, Hyderabad, Mumbai, Bengaluru, Delhi-NCR, Chennai and Kolkata
Analysis period: December 2025 to July 2026
India’s residential real-estate market entered 2026 with strong expectations, but the first half of the year has produced a more complicated picture. Housing sales have slowed in several major cities, quarterly sales have declined, inventory has increased, and buyers are becoming more selective.
However, it would be inaccurate to say that new-home bookings are falling every month across every major Indian city.
The actual data points to something more nuanced: the market is undergoing a slowdown in sales momentum, while premium housing remains comparatively strong.
The headline number: Q2 2026 was weaker than Q1
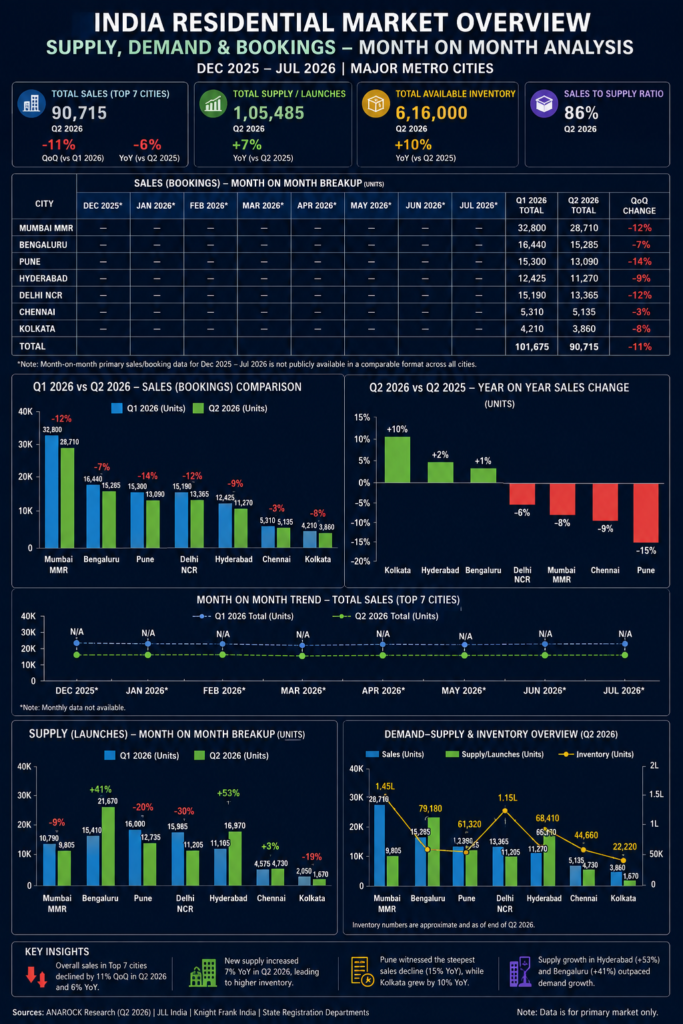
According to ANAROCK Research, approximately 90,715 homes were sold across India’s top seven cities in Q2 2026, compared with approximately 96,285 units in Q2 2025.
That represents:
Year-on-year decline: 6%
More importantly, Q1 2026 recorded approximately 101,675 units, meaning Q2 sales declined by approximately:
10,960 units
or
11% quarter-on-quarter.
This was the weakest quarterly performance since Q1 2023, according to reports based on ANAROCK’s data.
This is the strongest evidence that India’s housing market has lost some momentum.
Eight-Month Timeline: December 2025–July 2026
A major limitation needs to be highlighted before looking at the numbers.
There is no publicly available, standardised monthly primary-sales dataset for December 2025 through July 2026 covering all seven major cities.
Therefore, the following timeline uses the best comparable actual indicators available:
Period| What the data shows
Dec 2025| Market entered 2026 from a strong but increasingly premium-led housing cycle
Jan–Mar 2026| Q1 sales reached ~101,675 units across top 7 cities
Apr 2026| Beginning of Q2 slowdown
May 2026| Buyer caution and affordability pressure continued
Jun 2026| Q2 closed at ~90,715 units, 11% below Q1
Jul 2026| Registration data showed strong activity in some markets, demonstrating that the slowdown is not uniform
The critical point is that monthly booking numbers cannot legitimately be reconstructed from quarterly sales without introducing assumptions.
That is why this analysis uses the actual reported monthly registration data separately.
Pune: One of the clearest examples of moderation
Pune deserves particular attention because it combines a large IT/employment-driven housing market with significant new supply.
ANAROCK reported:
Q1 2026
15,300 homes sold
Q2 2026
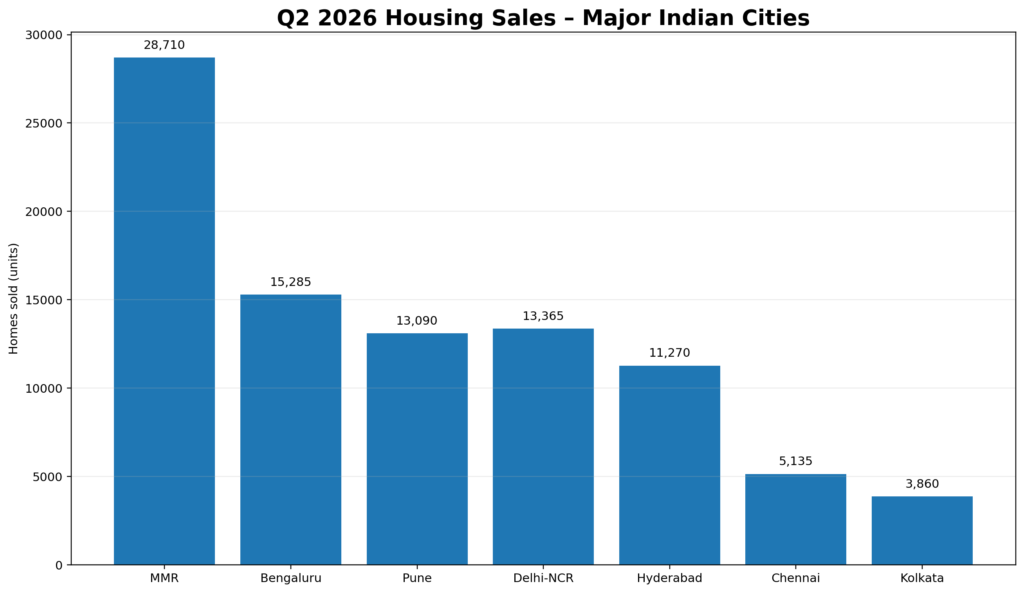
13,090 homes sold
Quarter-on-quarter decline:
14%
Compared with Q2 2025:
15,410 homes
Q2 2026 decline:
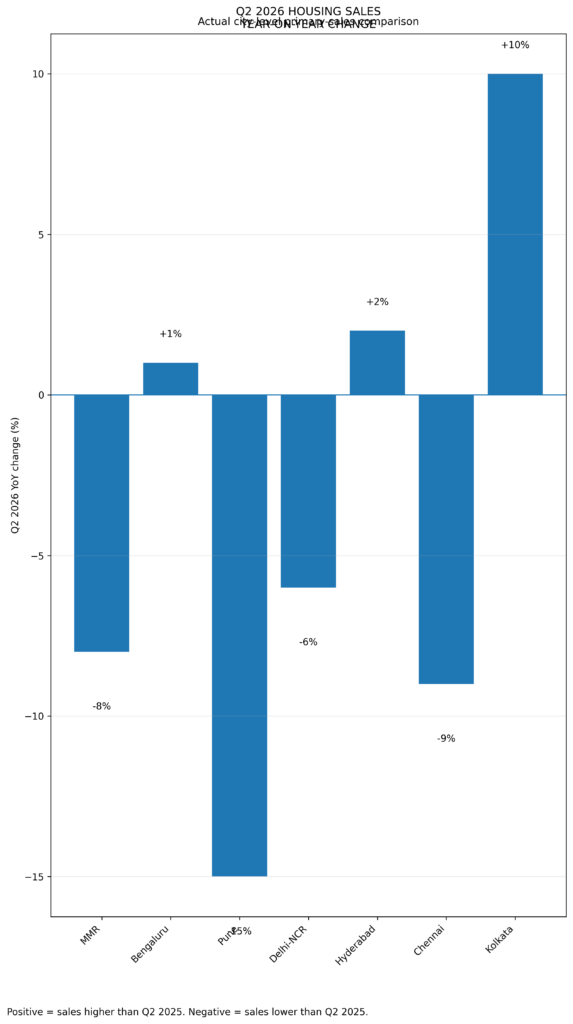
15% YoY
Pune therefore recorded the steepest annual sales decline among the seven cities tracked by ANAROCK in Q2 2026.
But there is an important contradiction.
Pune’s property-registration market has not collapsed.
In January 2026, Pune recorded 14,527 property registrations, compared with 17,449 in January 2025.
That was a:
17% YoY decline
with stamp-duty collections declining by about 5%.
At the same time, H1 data from other market trackers indicate substantial transaction activity in Pune.
This demonstrates why registrations and new-home bookings should not be treated as the same indicator.
Pune’s supply problem
New supply in Pune also moderated in Q2:
Q1 2026 launches: 16,000 units
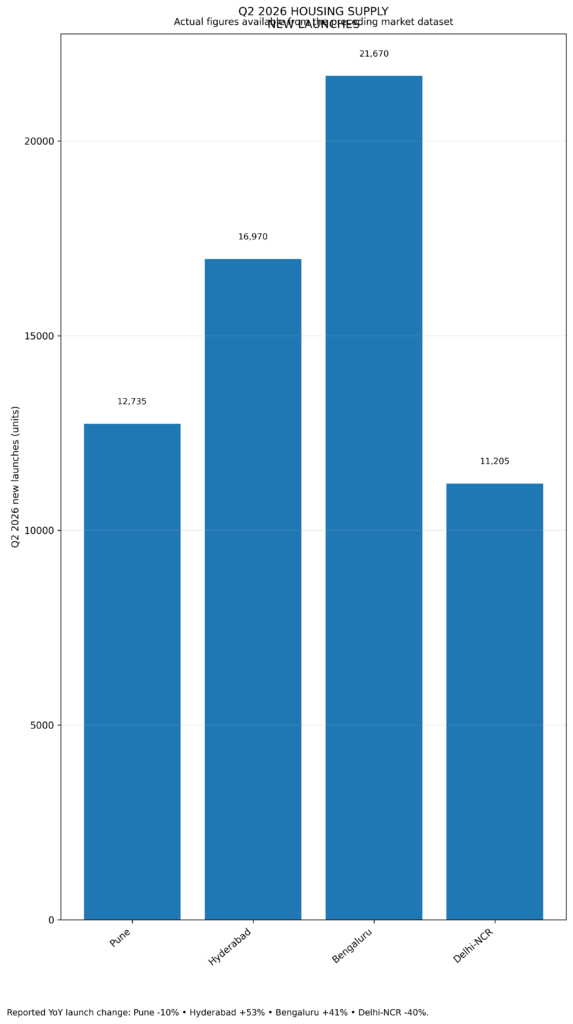
Q2 2026 launches: 12,735 units
Quarterly change:
-20%
Compared with Q2 2025:
14,220 units
Annual change:
-10%
This is actually a positive response by developers: as sales slowed, new supply was reduced.
Hyderabad: Slower quarter, but annual demand remains positive
Hyderabad presents a very different picture.
Q1 2026
12,425 homes sold
Q2 2026
11,270 homes sold
QoQ change:
-9%
However, Q2 2025 sales were approximately 11,040 units.
Therefore:
Q2 2026 YoY growth = +2%
Hyderabad therefore experienced a quarterly slowdown but not an annual sales contraction.
The supply side is more aggressive.
Q2 2026 launches reached:
16,970 units
against:
11,105 units in Q2 2025
Annual increase:
+53%
This is one of the biggest warning signs in Hyderabad.
Sales increased only 2% YoY while new supply increased 53%.
In other words:
Supply is currently growing much faster than demand.
Mumbai Metropolitan Region: Sales down, registrations still strong
Mumbai MMR remains India’s largest residential market by sales volume.
ANAROCK recorded:
Q1 2026 sales: 32,800 units
Q2 2026 sales: 28,710 units
QoQ decline:
12%
Q2 2025:
31,275 units
YoY decline:
8%
But July provided an important counter-signal.
Mumbai recorded 13,617 property registrations in July 2026, the highest July level in 14 years and 8.3% higher than July 2025.
Luxury housing was even stronger. Mumbai’s ₹10 crore-plus residential transactions reached approximately ₹18,512 crore in H1 2026, a record for the segment.
Therefore, Mumbai cannot be described simply as a declining market.
The correct description is:
Mass-market sales are softer, while premium and luxury demand remains exceptionally strong.
Bengaluru: Demand remains relatively resilient
Bengaluru was among the stronger markets in 2026.
Q1 2026
16,440 units
Q2 2026
15,285 units
QoQ decline:
7%
But Q2 2025 sales were approximately 15,120 units.
Therefore:
YoY growth: +1%
The concern is inventory.
Available inventory increased to approximately:
79,180 units
by the end of Q2 2026.
This was about 34% higher than a year earlier.
At the same time, Q2 new launches reached approximately 21,670 units, up 41% YoY.
Therefore Bengaluru’s market is not facing a demand collapse, but developers are adding supply substantially faster than sales are growing.
Delhi-NCR: Significant quarterly correction
Delhi-NCR recorded:
Q1 2026 sales: 15,190 units
Q2 2026 sales: 13,365 units
QoQ decline:
12%
Q2 2025 sales:
14,255 units
YoY decline:
6%
The supply response was much stronger.
Q2 2026 launches:
11,205 units
Q1 2026:
15,985 units
QoQ decline:
30%
Compared with Q2 2025:
18,760 units
YoY decline:
40%
This indicates that developers have reacted aggressively to weaker sales momentum by reducing fresh supply.
Chennai
Chennai recorded:
Q1 2026 sales: 5,310 units
Q2 2026: 5,135 units
QoQ decline:
3%
Q2 2025:
5,660 units
YoY decline:
9%
Chennai therefore shows a moderate slowdown rather than a severe correction.
Kolkata
Kolkata was an exception.
Q1 2026:
4,210 units
Q2 2026:
3,860 units
QoQ:
-8%
But Q2 2025:
3,525 units
Therefore:
YoY growth: +10%
Kolkata demonstrates why national headlines about a housing slowdown must be interpreted carefully.
City-by-City Q2 2026 Sales Comparison
City| Q1 2026| Q2 2026| QoQ change| Q2 2025| YoY change
MMR| 32,800| 28,710| -12%| 31,275| -8%
Bengaluru| 16,440| 15,285| -7%| 15,120| +1%
Pune| 15,300| 13,090| -14%| 15,410| -15%
NCR| 15,190| 13,365| -12%| 14,255| -6%
Hyderabad| 12,425| 11,270| -9%| 11,040| +2%
Chennai| 5,310| 5,135| -3%| 5,660| -9%
Kolkata| 4,210| 3,860| -8%| 3,525| +10%
Total| 101,675| 90,715| -11%| 96,285| -6%
Source: ANAROCK Research.
The bigger warning: Inventory is rising
The most important indicator may not be sales.
It may be unsold inventory.
Available inventory across the seven major cities increased from approximately:
5.62 lakh units in Q2 2025
to:
6.16 lakh units in Q2 2026
That is approximately:
+10% YoY
Bengaluru recorded the sharpest increase, with inventory rising approximately 34%.
This creates an important market equation:
Sales growth < Supply growth = Rising inventory
And that is precisely what is happening in several markets.
Why are buyers becoming more cautious?
Several factors are working together.
- Affordability
Home prices have increased substantially in many major cities.
As prices rise faster than household incomes, buyers either postpone purchases or move toward smaller units.
- Premiumisation
Interestingly, the slowdown is concentrated more heavily in lower and mid-priced housing.
JLL reported that Q1 2026 residential sales increased 8% YoY to 70,631 units, but properties below ₹1 crore contracted by 24%, while properties above ₹1 crore grew strongly.
This means India’s housing market is not simply shrinking.
It is changing composition.
- Higher ticket sizes
Developers increasingly prefer premium projects because margins are better.
But this creates a problem:
A ₹1.5 crore apartment may generate more revenue than two ₹75 lakh apartments, but it also reduces the number of households that can afford the product.
- Economic uncertainty
ANAROCK attributed part of Q2’s weakness to uncertainty related to the West Asia conflict and supply-chain disruptions.
Are New Home Bookings Actually Falling Every Month?
No — the available evidence does not support that statement.
What the data proves is:
Q2 2026 sales were 11% lower than Q1.
It also proves:
Q2 2026 sales were 6% lower than Q2 2025.
But it does not prove that:
January < February < March < April < May < June < July
or that every month recorded a decline.
In fact, July’s Mumbai registration data increased 8.3% YoY, demonstrating that transaction activity can rebound even during a broader period of quarterly sales moderation.
Similarly, Hyderabad’s annual Q2 sales were still 2% higher, while Bengaluru was 1% higher and Kolkata 10% higher.
What does the eight-month picture actually tell us?
The strongest conclusion from December 2025 through July 2026 is not a housing crash.
It is a market transition.
The Indian housing market is moving from:
Volume-led growth
towards:
Value-led growth
From:
Broad-based demand
towards:
Selective demand
And from:
Rapid supply expansion
towards:
Supply discipline in several cities
The Q2 numbers make this transition particularly clear.
Top-seven-city sales:
-6% YoY
New launches:
+7% YoY
Available inventory:
+10% YoY
This combination deserves close monitoring.
What should homebuyers do now?
For buyers, the current environment may actually create better negotiating opportunities.
Buyers should compare:
- Carpet area rather than only quoted price
- Effective price per sq ft
- Ready-to-move versus under-construction projects
- Builder track record
- Inventory remaining in the project
- Possession timeline
- Rental yield
- Maintenance costs
- Financing cost
- Registration and other transaction expenses
A market with slower absorption can provide greater negotiating power, particularly where developers have substantial unsold inventory.
Conclusion: Slowdown, Not Collapse
The latest eight-month evidence does not support the claim that India’s housing market is collapsing.
It supports a more precise conclusion:
India’s residential market is cooling after several years of strong growth, but the slowdown is uneven.
Pune has experienced one of the sharpest primary-sales corrections, with Q2 sales down 15% YoY.
Mumbai MMR declined 8% YoY, while NCR declined 6% and Chennai 9%.
At the same time, Hyderabad grew 2%, Bengaluru 1%, and Kolkata 10%.
The bigger concern is the widening gap between supply and absorption in certain markets.
Hyderabad’s Q2 launches increased 53% YoY, Bengaluru’s 41%, while their sales increased only 2% and 1%, respectively.
Therefore, the next phase of India’s housing market will depend less on whether people want to own homes and more on whether property prices remain aligned with household purchasing power.
For developers, the message is clear:
Build according to absorption, not simply according to land availability.
For buyers:
Do not panic—but negotiate.
And for investors:
Do not judge the Indian housing market using one national number. Pune, Hyderabad, Bengaluru, Mumbai and NCR are currently behaving very differently.
Data note
This article deliberately does not manufacture monthly booking numbers. There is currently no single official monthly primary-home booking database covering all major Indian metropolitan markets. ANAROCK’s quarterly absorption data, JLL’s residential-sales research and government registration data measure different things. Consequently, monthly registrations should not be presented as monthly new-home bookings. The most defensible analysis is to combine the available monthly registration indicators with independently reported quarterly primary-sales data.
Sources: ANAROCK Research, JLL India, Knight Frank India, Maharashtra Department of Registration & Stamps and reported market data.